Grundlæggende statistik
| Institutionelle ejere | 152 total, 145 long only, 0 short only, 7 long/short - change of -2,94% MRQ |
| Gennemsnitlig porteføljeallokering | 0.4260 % - change of -31,10% MRQ |
| Institutionelle aktier (lange) | 42.029.488 (ex 13D/G) - change of 0,10MM shares 0,18% MRQ |
| Institutionel værdi (lang) | $ 812.047 USD ($1000) |
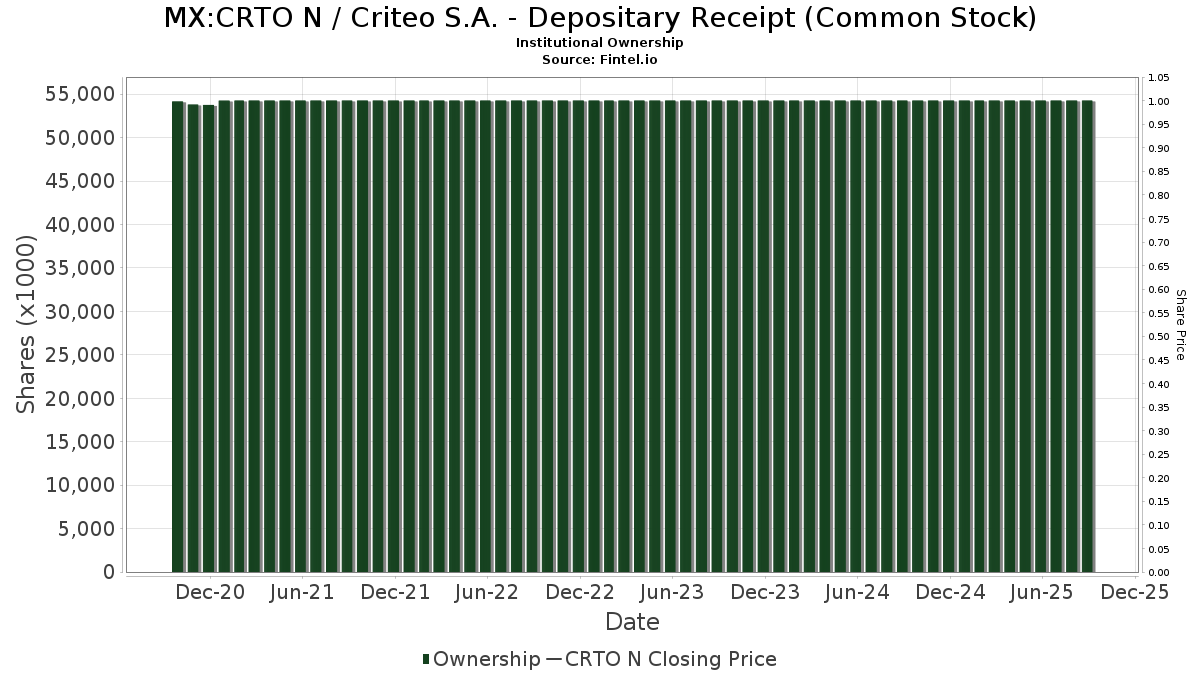
Institutionelt ejerskab og aktionærer
Criteo S.A. - Depositary Receipt (Common Stock) (MX:CRTO N) har 152 institutionelle ejere og aktionærer, der har indsendt 13D/G- eller 13F-formularer til Securities Exchange Commission (SEC). Disse institutioner har i alt 42,029,488 aktier. Største aktionærer omfatter Neuberger Berman Group LLC, Morgan Stanley, Senvest Management, LLC, DnB Asset Management AS, BlueCrest Capital Management Ltd, Alliancebernstein L.p., Acadian Asset Management Llc, Janus Henderson Group Plc, Nierenberg Investment Management Company, Inc., and Arrowstreet Capital, Limited Partnership .
Criteo S.A. - Depositary Receipt (Common Stock) (BMV:CRTO N) institutionel ejerskabsstruktur viser aktuelle positioner i virksomheden efter institutioner og fonde, samt seneste ændringer i positionsstørrelse. Større aktionærer kan omfatte individuelle investorer, investeringsforeninger, hedgefonde eller institutioner. Skema 13D angiver, at investoren besidder (eller besidder) mere end 5 % af virksomheden og har til hensigt (eller har til hensigt at) aktivt at forfølge en ændring i forretningsstrategi. Skema 13G indikerer en passiv investering på over 5%.
Fondens stemningsscore
Fund Sentiment Score (fka Ownership Accumulation Score) finder de aktier, der bliver mest købt af fonde. Det er resultatet af en sofistikeret, multi-faktor kvantitativ model, der identificerer virksomheder med de højeste niveauer af institutionel akkumulering. Scoringsmodellen bruger en kombination af den samlede stigning i oplyste ejere, ændringerne i porteføljeallokeringer i disse ejere og andre målinger. Tallet går fra 0 til 100, hvor højere tal indikerer et højere niveau af akkumulering for sine jævnaldrende, og 50 er gennemsnittet.
Opdateringsfrekvens: Dagligt
Se Ownership Explorer, som giver en liste over højest rangerende virksomheder.
AI+ Ask Fintel’s AI assistant about Criteo S.A. - Depositary Receipt (Common Stock).
Select a question to share a public post with an AI-crafted answer.
Thinking of good questions…
13F og NPORT arkivering
Detaljer om 13F-arkivering er gratis. Detaljer om NP-ansøgninger kræver et premium-medlemskab. Grønne rækker angiver nye positioner. Røde rækker angiver lukkede positioner. Klik på linket ikon for at se den fulde transaktionshistorik.
Opgrader
for at låse premium-data op og eksportere til Excel ![]() .
.
| Fil dato | Kilde | Investor | Type | Gennemsnitlig pris (Øst) |
Aktier | Δ Aktier (%) |
Rapporteret Værdi ($1000) |
Δ Værdi (%) |
Port Alloc (%) |
|
|---|---|---|---|---|---|---|---|---|---|---|
| 2026-02-13 | 13F | Walleye Capital LLC | 24.229 | -72,36 | 499 | -74,80 | ||||
| 2026-02-13 | 13F | Rhumbline Advisers | 2.095 | -8,11 | 43 | -15,69 | ||||
| 2026-02-09 | 13F | Frazier Financial Advisors, LLC | 0 | -100,00 | 0 | |||||
| 2026-02-05 | 13F | Td Private Client Wealth Llc | 2.361 | -19,03 | 49 | -26,15 | ||||
| 2026-02-17 | 13F | Vinva Investment Management Ltd | 26.817 | 824 | ||||||
| 2025-11-14 | 13F | Graham Capital Management, L.P. | 0 | -100,00 | 0 | |||||
| 2026-02-06 | 13F | Global Retirement Partners, LLC | 7.331 | 808,43 | 151 | 738,89 | ||||
| 2026-02-13 | 13F | Walleye Capital LLC | Put | 1.800 | 37 | |||||
| 2026-02-06 | 13F | EverSource Wealth Advisors, LLC | 365 | 162,59 | 8 | 133,33 | ||||
| 2026-02-17 | 13F | Wellington Management Group Llp | 0 | -100,00 | 0 | |||||
| 2025-11-10 | 13F | ANTIPODES PARTNERS Ltd | 0 | -100,00 | 0 | -100,00 | ||||
| 2026-02-17 | 13F | Jones Financial Companies Lllp | 86 | -30,08 | 2 | -50,00 | ||||
| 2026-02-05 | 13F | Atria Investments Llc | 0 | -100,00 | 0 | |||||
| 2026-01-26 | 13F | Private Trust Co Na | 239 | -62,36 | 5 | -71,43 | ||||
| 2026-02-13 | 13F | Caitong International Asset Management Co., Ltd | 25 | -96,74 | 1 | -100,00 | ||||
| 2026-02-02 | 13F | Qrg Capital Management, Inc. | 32.964 | 43,90 | 679 | 31,33 | ||||
| 2026-04-21 | 13F | Robeco Institutional Asset Management B.V. | 585.640 | 17,83 | 10.501 | 2,51 | ||||
| 2026-04-21 | 13F | Div Capital Phoenix Assets Ltd | 121.000 | 9,01 | 2.170 | -5,16 | ||||
| 2026-02-13 | 13F | Morgan Stanley | 4.723.794 | 21,58 | 97.357 | 10,88 | ||||
| 2026-04-17 | 13F | Bell Investment Advisors, Inc | 35 | 1 | ||||||
| 2026-04-20 | 13F | Ronald Blue Trust, Inc. | 1.448 | -38,41 | 26 | -47,92 | ||||
| 2026-02-17 | 13F | Two Sigma Investments, Lp | 399.395 | 48,95 | 8.232 | 35,83 | ||||
| 2026-02-09 | 13F | Huntington National Bank | 4 | 0 | ||||||
| 2026-02-17 | 13F | Jump Financial, LLC | 194.433 | 56,98 | 4.007 | 43,16 | ||||
| 2026-02-12 | 13F | Jane Street Group, Llc | Put | 11.600 | 239 | |||||
| 2026-02-12 | 13F | Jane Street Group, Llc | 216.543 | 341,32 | 4.463 | 302,71 | ||||
| 2026-02-13 | 13F | Transamerica Financial Advisors, Inc. | 35 | 1 | ||||||
| 2026-02-18 | 13F | Vident Advisory, LLC | 12.907 | 34,27 | 266 | 22,58 | ||||
| 2026-02-19 | 13F | Invesco Ltd. | 25.832 | 27,48 | 532 | 16,41 | ||||
| 2026-01-12 | 13F | CVA Family Office, LLC | 53 | 1 | ||||||
| 2026-04-13 | 13F | Mather Group, Llc. | 707 | 13 | ||||||
| 2026-02-17 | 13F | Cadian Capital Management, Lp | 0 | -100,00 | 0 | |||||
| 2026-04-16 | 13F | SG Americas Securities, LLC | 7.526 | 0 | ||||||
| 2026-02-17 | 13F | CastleKnight Management LP | 21.300 | -65,97 | 439 | -69,02 | ||||
| 2026-02-12 | 13F | Senvest Management, LLC | 4.397.322 | 4,02 | 90.629 | -5,14 | ||||
| 2026-02-13 | 13F | Charles Schwab Investment Management Inc | 98.336 | 13,09 | 2.027 | 3,10 | ||||
| 2026-02-17 | 13F | State Of Wisconsin Investment Board | 0 | -100,00 | 0 | |||||
| 2026-02-13 | 13F | Nierenberg Investment Management Company, Inc. | 888.888 | 109,17 | 18.320 | 90,74 | ||||
| 2026-02-13 | 13F | Stifel Financial Corp | 0 | -100,00 | 0 | |||||
| 2026-02-06 | 13F | Covestor Ltd | 684 | -61,20 | 0 | |||||
| 2026-02-17 | 13F | Two Sigma Securities, Llc | 12.504 | -12,57 | 258 | -20,43 | ||||
| 2026-02-17 | 13F | Bayesian Capital Management, LP | 0 | -100,00 | 0 | |||||
| 2026-02-17 | 13F | Trexquant Investment LP | 66.721 | 1.375 | ||||||
| 2025-11-13 | 13F | Clear Street Markets Llc | 0 | -100,00 | 0 | |||||
| 2026-02-12 | 13F | Federated Hermes, Inc. | 12.000 | -9,09 | 247 | -17,11 | ||||
| 2026-02-17 | 13F | Susquehanna Portfolio Strategies, LLC | 107.900 | 24,56 | 2.224 | 13,59 | ||||
| 2026-02-17 | 13F | Woodline Partners LP | 11.053 | 228 | ||||||
| 2026-02-11 | 13F | Fox Run Management, L.l.c. | 0 | -100,00 | 0 | |||||
| 2026-02-13 | 13F | Marshall Wace, Llp | 42.478 | 875 | ||||||
| 2026-04-10 | 13F | Centurion Wealth Management LLC | 11.250 | 0,00 | 202 | -12,99 | ||||
| 2026-04-07 | 13F | Farther Finance Advisors, LLC | 205 | 2,50 | 4 | -25,00 | ||||
| 2026-04-07 | 13F | Retirement Wealth Solutions LLC | 38 | 90,00 | 1 | |||||
| 2025-11-14 | 13F | Manufacturers Life Insurance Company, The | 0 | -100,00 | 0 | |||||
| 2026-02-13 | 13F | Arrowstreet Capital, Limited Partnership | 880.720 | 13,03 | 18.152 | 3,08 | ||||
| 2026-02-14 | 13F | Rockefeller Capital Management L.P. | 1.446 | 185,77 | 30 | 163,64 | ||||
| 2026-02-13 | 13F | Mml Investors Services, Llc | 11.916 | 13,81 | 246 | 3,81 | ||||
| 2026-02-17 | 13F | Advisory Services Network, LLC | 0 | -100,00 | 0 | |||||
| 2026-02-06 | 13F | HighTower Advisors, LLC | 157.527 | 5,65 | 3.247 | -3,65 | ||||
| 2026-02-17 | 13F | Public Employees Retirement System Of Ohio | 159.520 | 0,00 | 3.288 | -8,82 | ||||
| 2026-02-17 | 13F | Ameriprise Financial Inc | 536.136 | 1,59 | 11.050 | -7,35 | ||||
| 2026-02-13 | 13F | Neuberger Berman Group LLC | 7.748.712 | -1,17 | 159.699 | -9,86 | ||||
| 2026-01-27 | 13F | Waterfront Wealth Inc. | 141.766 | 81,39 | 2.868 | 78,25 | ||||
| 2026-02-11 | 13F | IMA Wealth, Inc. | 49 | 1 | ||||||
| 2026-02-13 | 13F | Quinn Opportunity Partners LLC | 25.504 | 0,00 | 526 | -8,85 | ||||
| 2026-02-12 | 13F | Campbell & CO Investment Adviser LLC | 19.709 | -32,41 | 406 | -38,39 | ||||
| 2026-02-10 | 13F/A | Northwestern Mutual Wealth Management Co | 88 | 0,00 | 2 | 0,00 | ||||
| 2026-01-27 | 13F | TD Waterhouse Canada Inc. | 43 | 0,00 | 1 | |||||
| 2026-02-10 | 13F | Bnp Paribas Arbitrage, Sa | 60 | -99,23 | 1 | -99,43 | ||||
| 2026-02-17 | 13F | Two Sigma Advisers, Lp | 187.100 | -21,35 | 3.856 | -28,27 | ||||
| 2026-04-17 | 13F | Roxbury Financial LLC | 150 | 0,00 | 3 | -33,33 | ||||
| 2026-02-13 | 13F | Vega Investment Solutions | 0 | -100,00 | 0 | |||||
| 2026-02-11 | 13F | Group One Trading, L.p. | Call | 25.000 | 4.066,67 | 515 | 3.861,54 | |||
| 2026-02-11 | 13F | Group One Trading, L.p. | Put | 1.800 | 350,00 | 37 | 311,11 | |||
| 2026-02-10 | 13F | Envestnet Asset Management Inc | 54.349 | -20,29 | 1.120 | -27,27 | ||||
| 2026-02-17 | 13F | Cannell Capital Llc | 0 | -100,00 | 0 | |||||
| 2026-04-14 | 13F | Banque Pictet & Cie Sa | 0 | -100,00 | 0 | |||||
| 2026-04-14 | 13F | Clean Yield Group | 100 | 0,00 | 2 | -50,00 | ||||
| 2025-11-14 | 13F | Wolverine Trading, Llc | Call | 16.500 | 370 | |||||
| 2026-02-17 | 13F | Mercer Global Advisors Inc /adv | 18.583 | -22,44 | 383 | -29,21 | ||||
| 2026-01-28 | 13F | WPG Advisers, LLC | 53 | 0,00 | 1 | 0,00 | ||||
| 2026-02-02 | 13F | Seizert Capital Partners, Llc | 189.971 | 3,40 | 3.915 | -5,71 | ||||
| 2026-02-13 | 13F | Headlands Technologies LLC | 16.101 | 34,10 | 332 | 22,14 | ||||
| 2026-02-11 | 13F | LPL Financial LLC | 21.404 | -4,49 | 441 | -12,85 | ||||
| 2026-02-17 | 13F | Tower Research Capital LLC (TRC) | 877 | -15,75 | 18 | -21,74 | ||||
| 2026-02-11 | 13F | Parallel Advisors, LLC | 901 | -56,70 | 19 | -61,70 | ||||
| 2026-02-17 | 13F | Millennium Management Llc | 793.474 | -27,70 | 16.353 | -34,07 | ||||
| 2025-11-13 | 13F | Lord, Abbett & Co. Llc | 0 | -100,00 | 0 | |||||
| 2026-02-06 | 13F | Larson Financial Group LLC | 24 | 0 | ||||||
| 2026-02-09 | 13F | Harbour Investments, Inc. | 46 | 0,00 | 1 | -100,00 | ||||
| 2026-04-15 | 13F | FNY Investment Advisers, LLC | 5.100 | 0,00 | 0 | |||||
| 2026-02-05 | 13F | Allworth Financial LP | 155 | 761,11 | 3 | |||||
| 2026-04-15 | 13F | FNY Investment Advisers, LLC | Call | 60 | 0,00 | 0 | ||||
| 2026-02-09 | 13F | King Luther Capital Management Corp | 188.910 | 79,91 | 3.893 | 64,05 | ||||
| 2026-02-10 | 13F | Goldman Sachs Group Inc | 178.546 | 40,69 | 3.680 | 28,28 | ||||
| 2026-02-13 | 13F | Caxton Associates Llp | 37.958 | 782 | ||||||
| 2026-02-12 | 13F | APG Asset Management N.V. | 232.175 | 77,27 | 4.074 | 61,73 | ||||
| 2026-02-12 | 13F | Barometer Capital Management Inc. | 137.800 | 2.730,73 | 544 | 394,55 | ||||
| 2026-02-17 | 13F | Alliancebernstein L.p. | 2.217.838 | -48,52 | 45.710 | -53,05 | ||||
| 2026-02-13 | 13F | Pathstone Holdings, LLC | 53.091 | 6,66 | 1.094 | -2,67 | ||||
| 2026-02-06 | 13F | Pnc Financial Services Group, Inc. | 173 | -4,95 | 4 | -25,00 | ||||
| 2026-02-10 | 13F | Natixis Advisors, L.p. | 0 | -100,00 | 0 | |||||
| 2026-02-17 | 13F | Janus Henderson Group Plc | 1.692.499 | 0,00 | 34.933 | -8,67 | ||||
| 2026-02-12 | 13F | Principal Securities, Inc. | 0 | -100,00 | 0 | -100,00 | ||||
| 2026-02-13 | 13F | Heron Bay Capital Management | 11.753 | 242 | ||||||
| 2025-11-24 | 13F | CIBC Private Wealth Group, LLC | 0 | -100,00 | 0 | -100,00 | ||||
| 2026-01-26 | 13F | KBC Group NV | 45.000 | 0,00 | 1 | -100,00 | ||||
| 2026-02-17 | 13F | Prelude Capital Management, Llc | 144.827 | 50,47 | 2.985 | 37,20 | ||||
| 2026-02-09 | 13F | Geode Capital Management, Llc | 33.316 | -33,38 | 687 | -39,29 | ||||
| 2025-10-27 | 13F | First Horizon Corp | 0 | -100,00 | 0 | -100,00 | ||||
| 2026-01-07 | 13F | Aventura Private Wealth, LLC | 0 | -100,00 | 0 | -100,00 | ||||
| 2026-02-06 | 13F | Gsa Capital Partners Llp | 112.123 | 469,53 | 2 | |||||
| 2026-02-17 | 13F | Numerai GP LLC | 0 | -100,00 | 0 | |||||
| 2025-11-14 | 13F | Point72 Asia (Singapore) Pte. Ltd. | 5.606 | 127 | ||||||
| 2025-11-04 | 13F | Gibbs Wealth Management | 12.812 | 33,75 | 454 | 19,84 | ||||
| 2026-02-17 | 13F | Royal Bank Of Canada | 2.034 | -20,39 | 43 | -25,86 | ||||
| 2026-02-17 | 13F | XTX Topco Ltd | 107.316 | 2.212 | ||||||
| 2026-01-29 | 13F | Sanctuary Advisors, LLC | 0 | -100,00 | 0 | -100,00 | ||||
| 2026-02-13 | 13F | Barclays Plc | 38.032 | 119,77 | 784 | 100,26 | ||||
| 2025-11-14 | 13F | Walleye Trading LLC | 0 | -100,00 | 0 | |||||
| 2026-02-13 | 13F | Y-Intercept (Hong Kong) Ltd | 94.819 | 88,55 | 1.954 | 72,01 | ||||
| 2026-02-18 | 13F | State of Tennessee, Treasury Department | 74.963 | 0,00 | 1.437 | -15,17 | ||||
| 2026-02-13 | 13F | Citigroup Inc | 76 | 2 | ||||||
| 2025-11-14 | 13F | Walleye Trading LLC | Call | 0 | -100,00 | 0 | ||||
| 2025-11-14 | 13F | Walleye Trading LLC | Put | 0 | -100,00 | 0 | ||||
| 2026-02-12 | 13F | Federation des caisses Desjardins du Quebec | 58.900 | -19,73 | 1.213 | -26,84 | ||||
| 2026-02-17 | 13F | Quadrature Capital Ltd | 24.190 | 499 | ||||||
| 2025-11-14 | 13F | OMERS ADMINISTRATION Corp | 0 | -100,00 | 0 | |||||
| 2026-02-12 | 13F | BlackRock, Inc. | 72.322 | 44,72 | 1.491 | 31,98 | ||||
| 2026-02-17 | 13F | Amundi | 56.212 | 1.159 | ||||||
| 2025-11-14 | 13F | National Bank Of Canada /fi/ | 0 | -100,00 | 0 | |||||
| 2025-11-12 | 13F | Steward Partners Investment Advisory, Llc | 0 | -100,00 | 0 | |||||
| 2026-04-17 | 13F | Cache Advisors, LLC | 1.347 | 24 | ||||||
| 2026-02-03 | 13F | Crossmark Global Holdings, Inc. | 18.724 | 0,15 | 386 | -8,77 | ||||
| 2026-02-17 | 13F | Citadel Advisors Llc | Put | 69.100 | 110,67 | 1.424 | 92,17 | |||
| 2026-02-17 | 13F | United Capital Financial Advisers, Llc | 0 | -100,00 | 0 | |||||
| 2026-02-17 | 13F | Citadel Advisors Llc | 42.566 | -41,44 | 877 | -46,59 | ||||
| 2026-02-13 | 13F | Balanced Rock Investment Advisor | 20.394 | -9,41 | 420 | -17,32 | ||||
| 2026-04-13 | 13F | Creative Financial Designs Inc /adv | 19 | 0,00 | 0 | |||||
| 2026-02-17 | 13F | Citadel Advisors Llc | Call | 37.900 | -11,66 | 781 | -19,40 | |||
| 2025-11-14 | 13F | Equitable Holdings, Inc. | 0 | -100,00 | 0 | |||||
| 2026-01-30 | 13F | Us Bancorp \de\ | 79.225 | -12,48 | 1.633 | -20,20 | ||||
| 2026-02-13 | 13F | Aigen Investment Management, Lp | 0 | -100,00 | 0 | |||||
| 2026-02-18 | 13F | Pillsbury Lake Capital LLC | 460.242 | 9.486 | ||||||
| 2026-02-03 | 13F | Manning & Napier Advisors Llc | 5 | 0 | ||||||
| 2026-02-12 | 13F | New York State Common Retirement Fund | 83.040 | 0,00 | 1.711 | -8,80 | ||||
| 2026-02-13 | 13F | Verition Fund Management LLC | 114.248 | 48,02 | 2.355 | 34,98 | ||||
| 2026-02-17 | 13F | Qube Research & Technologies Ltd | 473.448 | 11,55 | 9.758 | 1,72 | ||||
| 2025-10-27 | 13F | Kiker Wealth Management, LLC | 0 | -100,00 | 0 | |||||
| 2025-11-10 | 13F | MAI Capital Management | 0 | -100,00 | 0 | |||||
| 2026-01-23 | 13F | Assetmark, Inc | 8.923 | 7,58 | 184 | -2,14 | ||||
| 2026-02-10 | 13F | State of Wyoming | 13.945 | 10,38 | 287 | 0,70 | ||||
| 2026-02-17 | 13F | Susquehanna International Group, Llp | Call | 18.700 | 31,69 | 385 | 20,31 | |||
| 2026-02-09 | 13F | Legal & General Group Plc | 0 | -100,00 | 0 | |||||
| 2026-02-12 | 13F | BRYN MAWR TRUST Co | 8 | 0 | ||||||
| 2026-02-13 | 13F | Quarry LP | 412 | 8 | ||||||
| 2025-11-14 | 13F | Lazard Asset Management Llc | 0 | -100,00 | 0 | |||||
| 2026-02-17 | 13F | Aquatic Capital Management LLC | 10.189 | 1.418,48 | 210 | 1.293,33 | ||||
| 2026-02-17 | 13F | Susquehanna International Group, Llp | 26.281 | -67,01 | 542 | -69,94 | ||||
| 2026-02-17 | 13F | Susquehanna International Group, Llp | Put | 27.100 | 41,88 | 559 | 29,47 | |||
| 2026-02-10 | 13F | Commonwealth Of Pennsylvania Public School Empls Retrmt Sys | 73.878 | 0,00 | 1.523 | -8,81 | ||||
| 2026-02-13 | 13F | State Street Corp | 22.687 | -1,54 | 468 | -10,19 | ||||
| 2026-02-13 | 13F | Sei Investments Co | 167.192 | 50,80 | 3.446 | 37,52 | ||||
| 2026-01-29 | 13F | IMC-Chicago, LLC | Put | 18.400 | 379 | |||||
| 2026-02-09 | 13F | Royce & Associates Lp | 0 | -100,00 | 0 | |||||
| 2026-04-22 | 13F | Stone House Investment Management, LLC | 37 | 1 | ||||||
| 2026-01-27 | 13F | WealthCollab, LLC | 554 | 871,93 | 11 | 1.000,00 | ||||
| 2026-01-29 | 13F | IMC-Chicago, LLC | Call | 24.600 | -4,28 | 507 | -12,59 | |||
| 2025-11-14 | 13F | Cubist Systematic Strategies, LLC | 48.441 | -71,99 | 1.095 | -73,59 | ||||
| 2026-02-17 | 13F | Signature Equity Partners, LLC | 47 | 1 | ||||||
| 2026-02-17 | 13F | Bank Of America Corp /de/ | 99.712 | -56,10 | 2.055 | -59,96 | ||||
| 2026-02-12 | 13F | Brown Brothers Harriman & Co | 0 | -100,00 | 0 | |||||
| 2026-02-02 | 13F | VELA Investment Management, LLC | 551.407 | 28,18 | 11.364 | 16,90 | ||||
| 2026-02-05 | 13F | Bessemer Group Inc | 16.288 | 7.012,66 | 0 | |||||
| 2026-02-13 | 13F | Smartleaf Asset Management LLC | 240 | 5 | ||||||
| 2026-02-17 | 13F | D. E. Shaw & Co., Inc. | Put | 18.100 | -43,79 | 373 | -48,69 | |||
| 2026-02-17 | 13F | D. E. Shaw & Co., Inc. | 755.491 | 30,28 | 15.571 | 18,81 | ||||
| 2026-04-06 | 13F | GAMMA Investing LLC | 2.151 | 355,72 | 39 | 322,22 | ||||
| 2025-11-14 | 13F | Quantedge Capital Pte Ltd | 0 | -100,00 | 0 | |||||
| 2025-11-13 | 13F | Blueshift Asset Management, LLC | 0 | -100,00 | 0 | |||||
| 2026-02-13 | 13F | Pale Fire Capital SE | 18.097 | 373 | ||||||
| 2026-04-22 | 13F | Pinnacle Bancorp, Inc. | 366 | 0,00 | 7 | -14,29 | ||||
| 2026-01-29 | 13F | UBS Group AG | 241.538 | 216,46 | 4.978 | 188,75 | ||||
| 2026-02-06 | 13F | Vestmark Advisory Solutions, Inc. | 46.758 | 964 | ||||||
| 2026-02-17 | 13F | Boothbay Fund Management, Llc | 71.416 | 22,17 | 1.472 | 11,36 | ||||
| 2026-02-12 | 13F | Quadrant Capital Group Llc | 108 | 2 | ||||||
| 2026-02-11 | 13F | Group One Trading, L.p. | 0 | -100,00 | 0 | -100,00 | ||||
| 2025-12-02 | 13F | IFP Advisors, Inc | 0 | -100,00 | 0 | |||||
| 2026-04-22 | 13F | Janney Montgomery Scott LLC | 37.356 | 56,71 | 1 | |||||
| 2026-02-12 | 13F | Skandinaviska Enskilda Banken AB (publ) | 134.698 | 1,53 | 2.776 | -7,40 | ||||
| 2026-02-12 | 13F | Intrinsic Edge Capital Management LLC | 0 | -100,00 | 0 | |||||
| 2026-02-17 | 13F | Engineers Gate Manager LP | 94.384 | -17,08 | 1.945 | -24,38 | ||||
| 2026-02-09 | 13F | Ballast Asset Management, LP | 181.678 | -3,29 | 3.744 | -11,80 | ||||
| 2026-04-07 | 13F | Signaturefd, Llc | 1.344 | 918,18 | 24 | 1.100,00 | ||||
| 2026-02-17 | 13F | Advisor Group Holdings, Inc. | 675 | -57,31 | 14 | -64,86 | ||||
| 2026-02-18 | 13F | GWM Advisors LLC | 501 | 35,04 | 10 | 25,00 | ||||
| 2026-02-06 | 13F | Handelsbanken Fonder AB | 0 | -100,00 | 0 | |||||
| 2026-02-12 | 13F | Orchard Capital Managment, LLC | 57.293 | 1,31 | 1.181 | -7,67 | ||||
| 2026-02-17 | 13F | Point72 Asset Management, L.P. | 143.476 | 73,49 | 2.957 | 58,21 | ||||
| 2026-02-11 | 13F | Clearbridge Investments, LLC | 263.036 | -7,06 | 5.421 | -15,23 | ||||
| 2026-02-11 | 13F | Jpmorgan Chase & Co | 214.066 | -39,15 | 4.412 | -44,52 | ||||
| 2025-11-14 | 13F | Walleye Capital LLC | Call | 0 | -100,00 | 0 | -100,00 | |||
| 2026-02-12 | 13F | Groupe la Francaise | 0 | -100,00 | 0 | |||||
| 2025-11-14 | 13F | Raymond James Financial Inc | 0 | -100,00 | 0 | |||||
| 2026-02-10 | 13F | Acadian Asset Management Llc | 2.108.578 | -0,43 | 43 | -8,51 | ||||
| 2026-02-05 | 13F | DnB Asset Management AS | 4.258.161 | 2,94 | 87.761 | -6,13 | ||||
| 2026-02-12 | 13F | Hrt Financial Lp | 76.800 | 2 | ||||||
| 2026-01-30 | 13F | State of New Jersey Common Pension Fund D | 11.712 | 0,00 | 241 | -8,71 | ||||
| 2026-02-13 | 13F | Black Creek Investment Management Inc. | 0 | -100,00 | 0 | |||||
| 2026-02-17 | 13F | BlueCrest Capital Management Ltd | 2.260.000 | 0,00 | 46.579 | -8,81 | ||||
| 2026-02-13 | 13F | Wells Fargo & Company/mn | 25.024 | 51,82 | 516 | 38,44 | ||||
| 2026-01-22 | 13F | Bear Mountain Capital, Inc. | 0 | -100,00 | 0 | |||||
| 2026-03-26 | 13F | Leonteq Securities AG | 0 | -100,00 | 0 | |||||
| 2026-02-11 | 13F | Deutsche Bank Ag\ | 29.864 | -33,32 | 615 | -39,23 | ||||
| 2026-02-02 | 13F | Montag A & Associates Inc | 0 | -100,00 | 0 |